Function of 3 variables
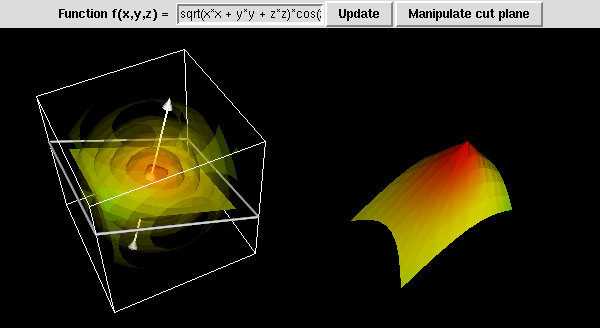
I've written a program to draw a function of 3 variables, plotter_3d.py. The display is split into left and right windows. The left window draws the function in 3d, using transparent iso-surface contours. An opaque cut plane is also drawn in the left window. The value of the function on the cut plane is dislayed in the right window (similar to the 2D plotter).Run it with "vtkpython plotter_3d.py". Enter a function of x, y and z in the box and press "update" to draw the function. The Python "math" module has been imported, so you can use anything defined there.
The "Manipulate cut plane" button brings up the white cube (seen in the left window in the screen shot). The cut plane can be translated by grabbing the plane, or rotated by grabbing the normal vector. Press the button again to make the white cube disappear.